FACTS ABOUT THE SAVINGS OF FOSSIL FUEL
BY WINDTURBINES IN THE NETHERLANDS1.
C. (Kees) le Pair
Abstract.
Electricity production in The Netherlands using renewables, especially
wind, has grown to a size
that makes it visible in the national statistics of electricity generation. Its influence on
fossil fuel consumption can be determined. Based on these 'official figures' we show the actual
contribution of fuel reduction to be equivalent to about 4,1% of the installed -
'nameplate' - capacity.
The actual data also provide some insight into the mechanism that causes wind
electricity to have such a dramatically small influence on primary fuel consumption.
Introduction
Renewables are being introduced into electricity
generation
in order to save fossil fuel and to
reduce the amount of CO2 emissions. In an early
stage of this process a simple supposition convinced authorities and the public at large
of the effectiveness of using renewables. A kWh of electricity produced free of
CO2, would replace
a kWh conventionally produced. It would therefore save the amount of the fossil fuel otherwise needed to
produce that same quantity of electricity.
This simple notion has been criticized. The renewable electricity generation influences the way conventional units
operate which in turn reduces their efficiency, and actually results in less savings. Conventional units are necessary
when
some of the renewable resources like wind and PV solar, are not available. They come
when the wind blows or only during daylight hours. Electricity storage, which would alleviate this problem, is only
feasible in very special situations. Otherwise it is too expensive.
World wide, a debate has evolved between the protagonists of large-scale renewable systems and
critics who argue that the systems do not function as promised. Because
quite substantial amounts of money are involved, there is a lot at stake. Many people, whose incomes and occupations
are linked to the renewable sector do not appreciate the arguments put forward by the
critics.
Politicians, who have tried hard in the past to push renewables, risk damage to their
green image if they suddenly change sides.
The dispute has continued for some time because of inherent difficulties in
determining the decisive facts that would facilitate objective decision making. First of all, the electricity
systems in different countries and regions are not alike. Therefore the way in
which intermittent sources influence the
overall operation differs from country to country. Thus, arguments that are valid in one place may not, or not
as equally well, influence
matters elsewhere. Secondly there is reluctance among producers to reveal the relevant
production data. They claim that it is competitively sensitive data. Also we must realize that some of the data
necessary to make final conclusions are simply not available. Thirdly, as some of the renewables advocates say, present
day figures are not conclusive because the overall system is changing; for instance stronger interconnections between
regions and so-called smart grids may improve the situation.
We took an active role in this debate as can be read in a number of earlier contributions (2,3...9). We have been in
contact with other investigators abroad, whose work helped us to better understand the complexity of the
problem and strengthened our conviction that there is something fundamentally wrong with today's large scale renewable
development. To mention but a few, I'd ask the reader to review the work on developments in the USA by W.
Post (10) and on Denmark by
H. Sharman (11) and P.F. Bach(12). There are many more excellent contributions and I apologize
to their authors for not listing them all.
Due to the lack of all the necessary data many studies have been based on models filled in with
available, though incomplete, data and topped up with general knowledge about systems and components.
Noteworthy exceptions are the studies by BENTEK on the electricity systems of Texas and Colorado (13),
of F. Udo on the Irish case (5, 7, 9) and several studies about Denmark (11, 12).
BENTEK used the actual pollutants' emission data to show that
adding wind did not achieve the objective of reducing the emissions. Udo used the detailed production time series provided
by the Irish grid operator EIRGRID to show that wind accomplished much less than
previously assumed. In Denmark the wind penetration
is so strong that the results show up in all kinds of national statistics. They reveal that the Danes can use only half
of their wind made electricity. They face other disadvantages too. For instance, they
pay about twice as much for electricity as the French do.
However, these facts on foreign systems are not sufficient to influence policy
at home. The argument
that situations and systems are not alike and may not be easily compared provide
an all too convenient veil to hide behind.
We have summed up most of the critical arguments in a recent article in EurophysicsNews (8). In a previous
paper, I presented a model of a hypothetical wind turbine assembly in the center of the Netherlands using
actual wind behavior and known properties of gas-fueled backup generation to show that wind electricity might even
increase fuel use (6). But, of course, a model is not as convincing as actual facts.
Electricity production in the Netherlands
The Netherlands Central Bureau of Statistics collects data on electricity
production. It composes annual time-series which are publicly available on its website 'Statline' (14).
At present the relevant series
cover the years 1998 - 2010. Some of the data of 2010 are still labeled 'provisional'. But the actual figures that
are expected later in the summer of 2012 will not differ too much from those
already published. They will therefore not influence the trends we
have computed and used below.
Renewable production has now reached a high enough level to show up in these
macro statistics. We have
analyzed them and present the results here. We produced graphs from which we derived the current trends. In
our calculations we used these trend results. Because there is some spread in the data, actual values for a certain year
may differ somewhat from the ones used. The graphs we present will show how much uncertainty this implies.
Throughout this contribution we use GWy (Gigawattyear) as the unit of electric energy and
caloric energy. Power is expressed in GWe (Gigawattelectric) (15) .
Contribution to the national electricity production in 2010 from trends.
| primary energy source |
production [GWy] |
[%] of total |
annual increase [GWy] |
specific growth p.a. [%] |
|---|---|---|---|---|
fossil production nuclear production renewable energy natural gas coal oil other fossil biomass wind hydro power solar (PV) other energy carriers |
11,00 0,46 1,26 7,80 2,62 0,01 0,49 0,73 0,49 0,011 0,006 0,34 |
84,42 3,53 9,67 59,86 20,11 0,08 3,76 5,60 3,76 0,08 0,05 2,52 |
0,155 0,002 0,091 0,177 -0,013 -0,004 -0,0049 0,0492 0,0412 -0,0001 0,0005 0,0042 |
1,41 0,43 7,22 2,27 -0,50 -40,00 -1,00 6,74 8,37 -0,89 8,06 1,25 |
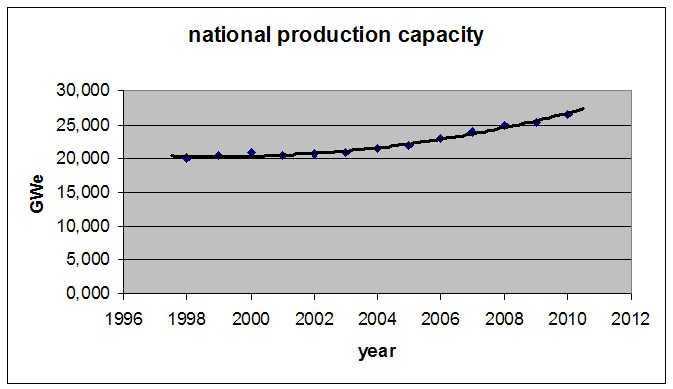
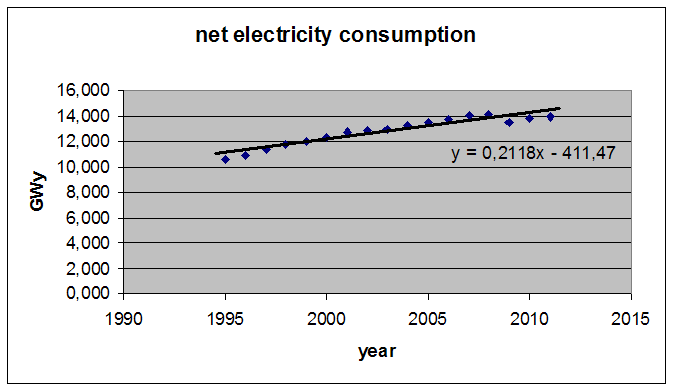
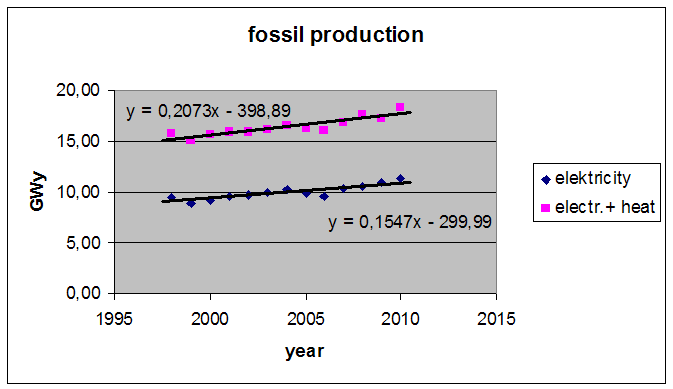
During the whole period domestic demand exceeded national production. The Netherlands was a net importer of electricity. The situation is changing however. Capacity was augmented and we expect the country to be a net exporter of electricity by 2012. We depict some characteristics in the next four graphs.
| 1. national production capacity | 2. national electricity consumption |
|
|
| 3. fossil production | 4. renewable production |
|
|
Notes:
-
Average capacity growth over the past four years ≈ 0,9 GWe p.a.
-
Consumption growth ≈ 0,212 GWy p.a.
-
A substantial part of the electricity production is accompanied by heat production. This heat is used for industrial purposes, process heat, green houses and domestic heating. It enhances useful utilization of primary energy, although it slightly reduces the efficiency of electricity production.
-
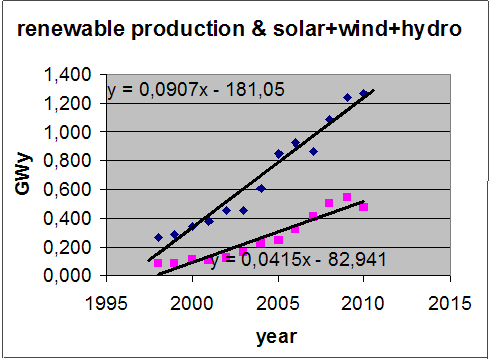
Renewable production includes wind, solar and hydro; these three together are also depicted separately. Actually the renewable electricity in the Netherlands is derived almost entirely from biomass and wind.
-
The growth of fossil+renewable production (0,246 GWy p.a.) exceeds the consumption growth. Net imports diminish.
The growth of fossil production is entirely due to increase of natural gas, see table 1. However, in the year 2012 there is quite some new coal capacity under construction.
Another characteristic is decentralized production. About 8 GWy is produced by traditional electricity companies. Another 5 GWy is made in a decentralized manner by industrial and other companies and by agricultural firms.
Efficiency
Efficiency is a crucial issue with electricity production. The CBS offers
data about fuel consumption in caloric units (TJ) for the different fuels used. There are also data about the
fuel consumption of different installations. But analysis is complicated by the fact that nowadays many generating
units use fuel mixes. E.g. Steam turbines, once only coal fired, now have extensions for
gas. Some Open Cycle Gas
Turbines (OCGT) use waste industrial gas, which they top up with natural gas. And even the dominant generating
type of Combined Cycle Gas Turbines (CCGT) may get some primary energy from burning coal.
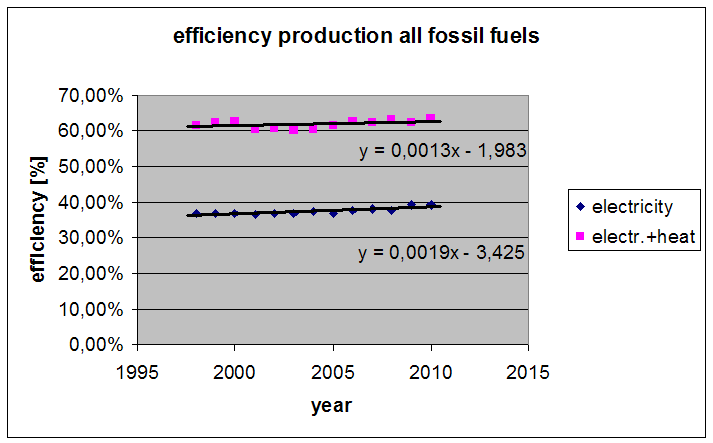
Efficiency of conventional electricity generation, η, is defined as:
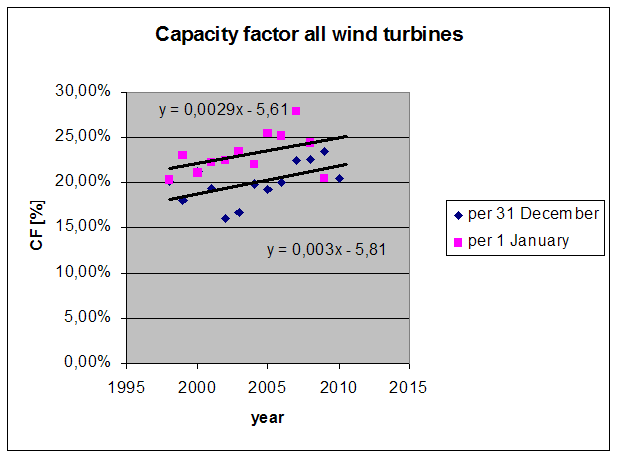
Windturbines convert wind energy directly into electric energy. There is a theoretical value for the fraction of wind energy a turbine can extract under favourable conditions. However, when the wind is not strong enough, the turbines produce less or even nothing at all. When the wind is too strong the turbines have to be stopped, also then there is no production. Therefor a capacity factor is used. It is defined as:
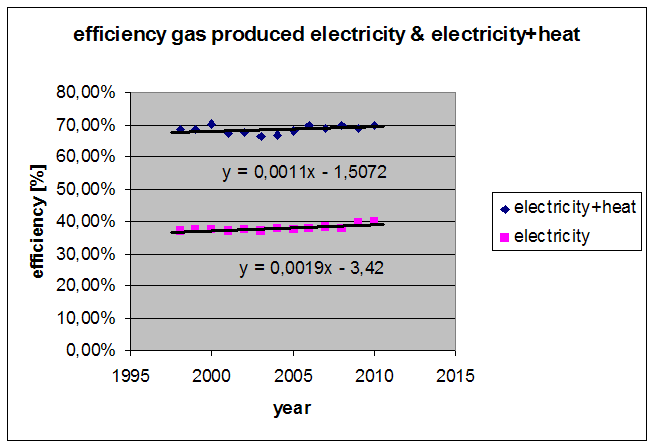
We present some of the relevant CBS data in the next series of graphs.
| 5. efficiency total fossil fuels | 6. capacity factor all wind turbines |
|
|
| 7. coal efficiency | 8. natural gas efficiency |
|
|
Notes:
-
Wind generating capacity grew fast. The exact time of the start of operations of new developments is unknown. Therefore we calculated CF using the installed capacity at the beginning and at the end of a year. The real value is somewhere in between. Currently about 23% for all together.
-
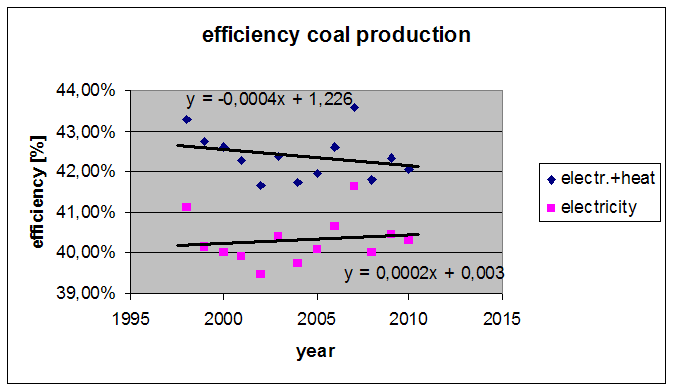
The trend of η(coal) change is small compared to the scatter of the data. We consider this insignificant.
-
There is more to say about the efficiency of gas. First of all we notice a remarkably low electric efficiency - even lower than that of coal production. Although there is a slight and steady improvement, this is nevertheless lower than we expect; see below.
Efficiency anomaly
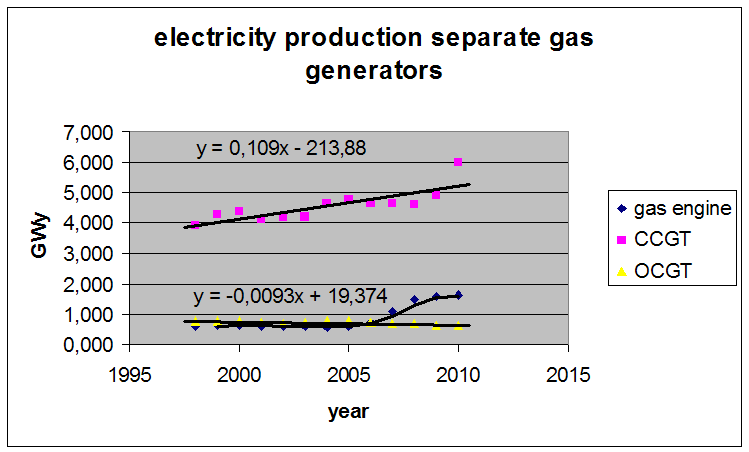
The electricity production using natural gas is mostly by CCGTs. Then there is a contribution by gas engines and finally by OCGTs. The separate contributions
are depicted in figure 9.
9. production by different types of gas-fueled generators
 Properties of the dominant generators in the Netherlands when operating under design conditions
are as follows:
CCGT. For older types η ≈ 0,55. The newest types have η ≈ 0,60. The capacity has been extended by adding the more efficient types. Over the whole period one might expect about 40% replacement by the newer types. The present average efficiency is therefore estimated to reach η ≈ 0,59 (16).
The steam turbines are mainly coal fired. Their η ≈ 0,455 (16).
The OCGT number shows some increase, although the intention is to use them less because of their low efficiency, which have η ≈ 0,32 (16).
One can speculate about the reasons for adding
yet more OCGT generators. One reason could be the need to compensate for rapid variations
caused by windpower. They are also used in connection with low caloric waste gas of the steel
mills. Given that the steel mills have not increased in capacity,
this is therefore not the driver to install more of them.
The gas engine is popular among small industrial companies and the agricultural sector. η varies much with the size: ≈ 0,26 – 0,45 (17).
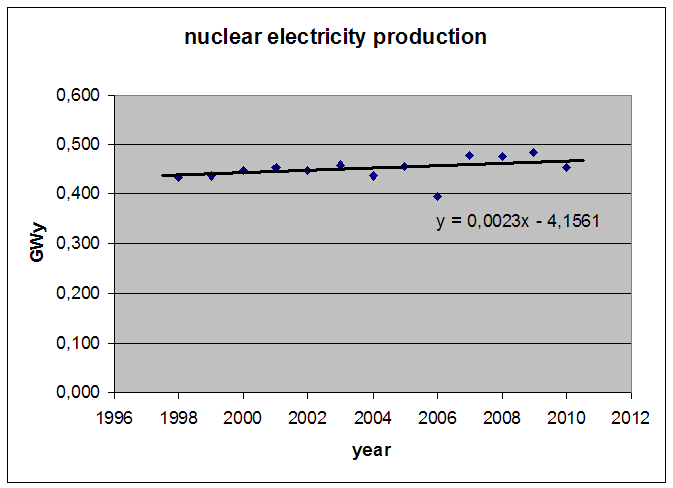
The nuclear reactor shows a stable behavior. After a renovation around 2007 a steady η of about 0,348 rose stepwise to 0,377(18) where it remains.
No generator works all year round at design capacity. Repairs and normal maintenance
prevent this. Taking this
into account the data show that coal fired generation and the nuclear installation perform as expected. They are
used as 'must run' units providing power in the range not affected by daily or even seasonal variations. The
difference between their actual performance and the theoretical one under design
conditions is small. It
can be attributed to these normal maintenance windows stops and some minor contribution to
demand
variations.
For the gas segment this is different. Taking into account the numbers of different generator
types, we would expect η to be 0,51. The actual efficiency according to the national
CBS data
is ≈ 0,394, i.e. about 12% less. This cannot be explained by repairs and
maintenance alone. Here we see the influence of ramping: lowering and raising the production and of multiple
stops and start-ups in order to cope
with variations in demand and variations in supply by the increase in irregular production such as wind power.
In former discussions with the responsible Minister we were told that these variations would not
adversely affect
the efficiency by more than 1 or 2%. The actual data show that these effects
have much more influence.
Stops and starts and steep ramp ups/downs influence the efficiency much more than 2%. This raises
the question what the effect of wind electricity really is and how much it impacts the consumption of fossil fuel?
Fossil fuel saving by renewables
In order to compute the efficiency with which electricity produced
by renewables saves fossil fuel, we write the national production, E(t), as sum of its components:
where: i = f (fossil-fuel produced electricity), n (nuclear ibid), r (by renewables ibid),
o (by other energy carriers ibid).
From the CBS data we derive the trends over the period 1998 - 2010:
Ef(t) = 0,1547 x Yr – 299,99 (fig. 3)
En(t) = 0,0023 x Yr – 4,1561 (fig. 10 below)
Er(t) = 0,0907 x Yr – 180,5 (fig. 4)
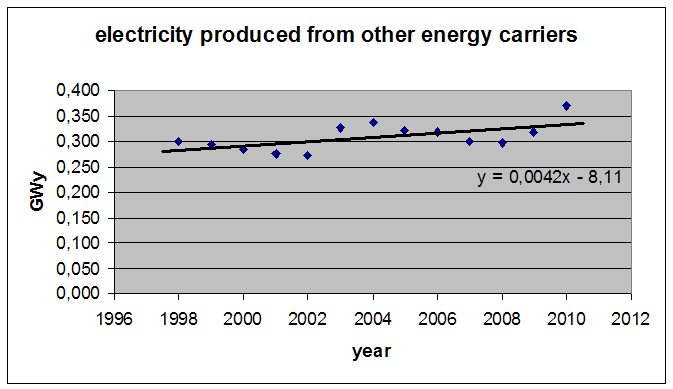
Eo(t) = 0,0042 x Yr – 8,11 (fig. 11 below)
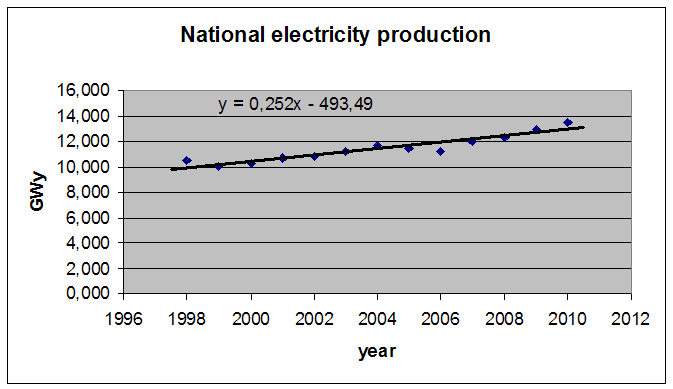
E (t) = 0,252 x Yr – 493,49 (fig. 12 below)
Yr = 1998, 1999, ..., 2010.
The unit of energy = GWy.
NB. Adding the four components would result in:
E (t) = 0,2519 x Yr – 492,7561
The difference is due to rounding though is not visible in the graph.
The electricity production is growing (dE(t)/dt). The annual increment being
ΔE = 0,252 GWy.
ΔEf = 0,155 GWy
ΔEn = 0,002 GWy
ΔEr = 0,091 GWy
ΔEo = 0,004 GWy
In order to realize the same growth without renewable contribution, the fossil contribution would have to increase:
ΔE'f = 0,155 + 0,091 = 0,246 GWy. The
incremental saving of fossil fuel by renewables is due to 0,091 GWy of electric energy. If this would be 100%
effective, we would see a caloric saving equal to 0,091 / ηe,f(t).
The CBS data let us calculate ηe,f:
ηe,f(t) =
0,0019 x Yr - 3,425 (fig. 5)
yielding: ηe,f(2010) = 0,394. As a
result this fuel saving would be equivalent to its caloric content: 0,091 / 0,394 = 0,231 GWy.
The CBS data also allow us to calculate what this contribution actually does. The consumption of
fossil fuel, If(t), is among the Statline data provided:
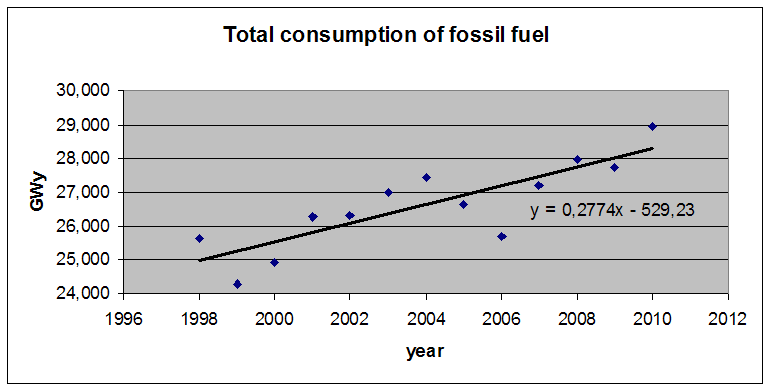
If(t) = 0,2774 x Yr - 529,23 GWy (fig. 13 below)
This means that at present the system needs an annual increment of fuel equivalent to:
ΔIf(2010) = 0,2774 GWy. Under the same
circumstances an increase of fossil produced electricity of 0,246 GWy in stead of 0,155 GWy
would require:
ΔIf'(2010) =
0,246 x 0,277 / 0,155 = 0,440 GWy
which is 0,440 - 0,277 = 0,163 GWy more than at present.
The 0,091 GWy renewable incrementally produced electricity therefore does not save 0,231 GWy but 0,163 GWy,
which means it is 0,163 / 0,231 = 70,6% effective.
|
Please note: the validity of the differential approach to the whole of the developments
rests on the data.
All but the total capacity and the change in import/export (not shown) can be represented by linear trends.
These two exceptions were not used in the calculations. Renewables were virtually not
on the scene before 1998.
|
| 10. nuclear electricity production | 11. electricity from other sources |
|
|
| 12. national electricity production | 13. consumption of fossil fuel |
|
|
Fossil fuel saving by wind power
The electricity production of other renewables than wind and biomass
is negligible. PV solar - another intermittent source, which could influence normal conventional production
-
contributes < 0,5% of all renewable production. Hydro makes about 1% and is not considered a disturbing
contributor.
So for the time being we deal only with wind and biomass, presently contributing 0,49 GWy and 0,73 GWy respectively.
Biomass. We have not investigated the merits and problems of biomass-produced electricity as
thoroughly as
we did with wind for obvious reasons. We suppose the conversion of liquid or gas fuel obtained from bio-material
into electricity to be similar to the conversion of fossil fuels. If any problem exists, it is with the process of
turning biomass into these fuels, i.e. a problem preceding the electricity production proper. There is no
problem with random electricity supply variations. Bio-fuel can be stored. The generating
equipment is also the same.
If biomass does have issues these are problems arising before it has been made into fuel. They are not
visible in the Statline statistics dealing with electricity. One could think of costs - also energy costs -
connected with collecting bio-waste, producing energy-rich crops, fertilizers, harvesting etc. There are
other considerations regarding the
competition with food production, acquiring soil to grow them and so on. We have studied the contents of a
recent lecture on bio fuels by H.O. Voorma in which he outlines possibilities and difficulties of producing enough
biomass for energy purposes (19). We understand there are quite some technological difficulties to tackle before
biomass can be counted on in sufficient quantity to substantially fill our energy needs. We would add that it
is necessary, as with other renewables, to do thorough energy studies of the whole chain in advance,
before we decide to apply biomass on a large scale. If not, we cannot
exclude that what is
advocated as a solution, will turn out to be an expensive hoax, costing more in terms of energy than it delivers.
For the present study this is of no relevance. Bio-fuel is available in small quantities and it can be used
in a conventional way to produce electricity. Apart from economic matters like costs, it is a matter of
straightforward reliable operation based on known techniques. Therefore we assume that producing bio-based electricity
is not different from that with fossil fuel. I.e. producing according to demand. This is a very important consideration, because
it implies that adding bio electricity to the grid, does not impair the functioning and efficiency of other units.
Thus the reduction of the efficiency when adding renewable electricity to the grid, which we calculated
in the preceding section, cannot be attributed to bio electricity. It must be solely due to the intermittent character of
wind power (6).
The (trend) share of wind electricity equals 0,492 GWy, that of biomass: 0,732 GWy in 2010. Together this amounts
to 1,224 GWy. 70,6% of this amount is actually saving fossil fuel. This reduces the saving
of fossil produced electricity to
0,706 x 1,224 = 0,864 GWy. The addition of bio-electricity is assumed to be 100% effective. This leaves for wind:
0,864 - 0,732 = 0,132 GWy of electricity saving. This should be compared with the actual 0,492 GWy fed into the
grid by wind developments. This leads to the conclusion:
Wind electricity. However, there is another catch, which does not show up in the Statline statistics.
The construction of windturbines, their installation, grid adaptation and connection require considerable investments
of energy. Some think these costs should not be taken into account because that is also not done for conventional
plants. This is erroneous. Conventional plants are being installed to produce electricity according to societal
demand. Wind turbines are not. They are being added to the system in order to save fuel and to diminish CO2 emissions. The question of whether they actually do therefore
becomes essential. If not, they would only be superfluous
supplements adding to the investment and other costs of the system.
The matter of energy costs associated with wind developments is another topic about which there is much dispute.
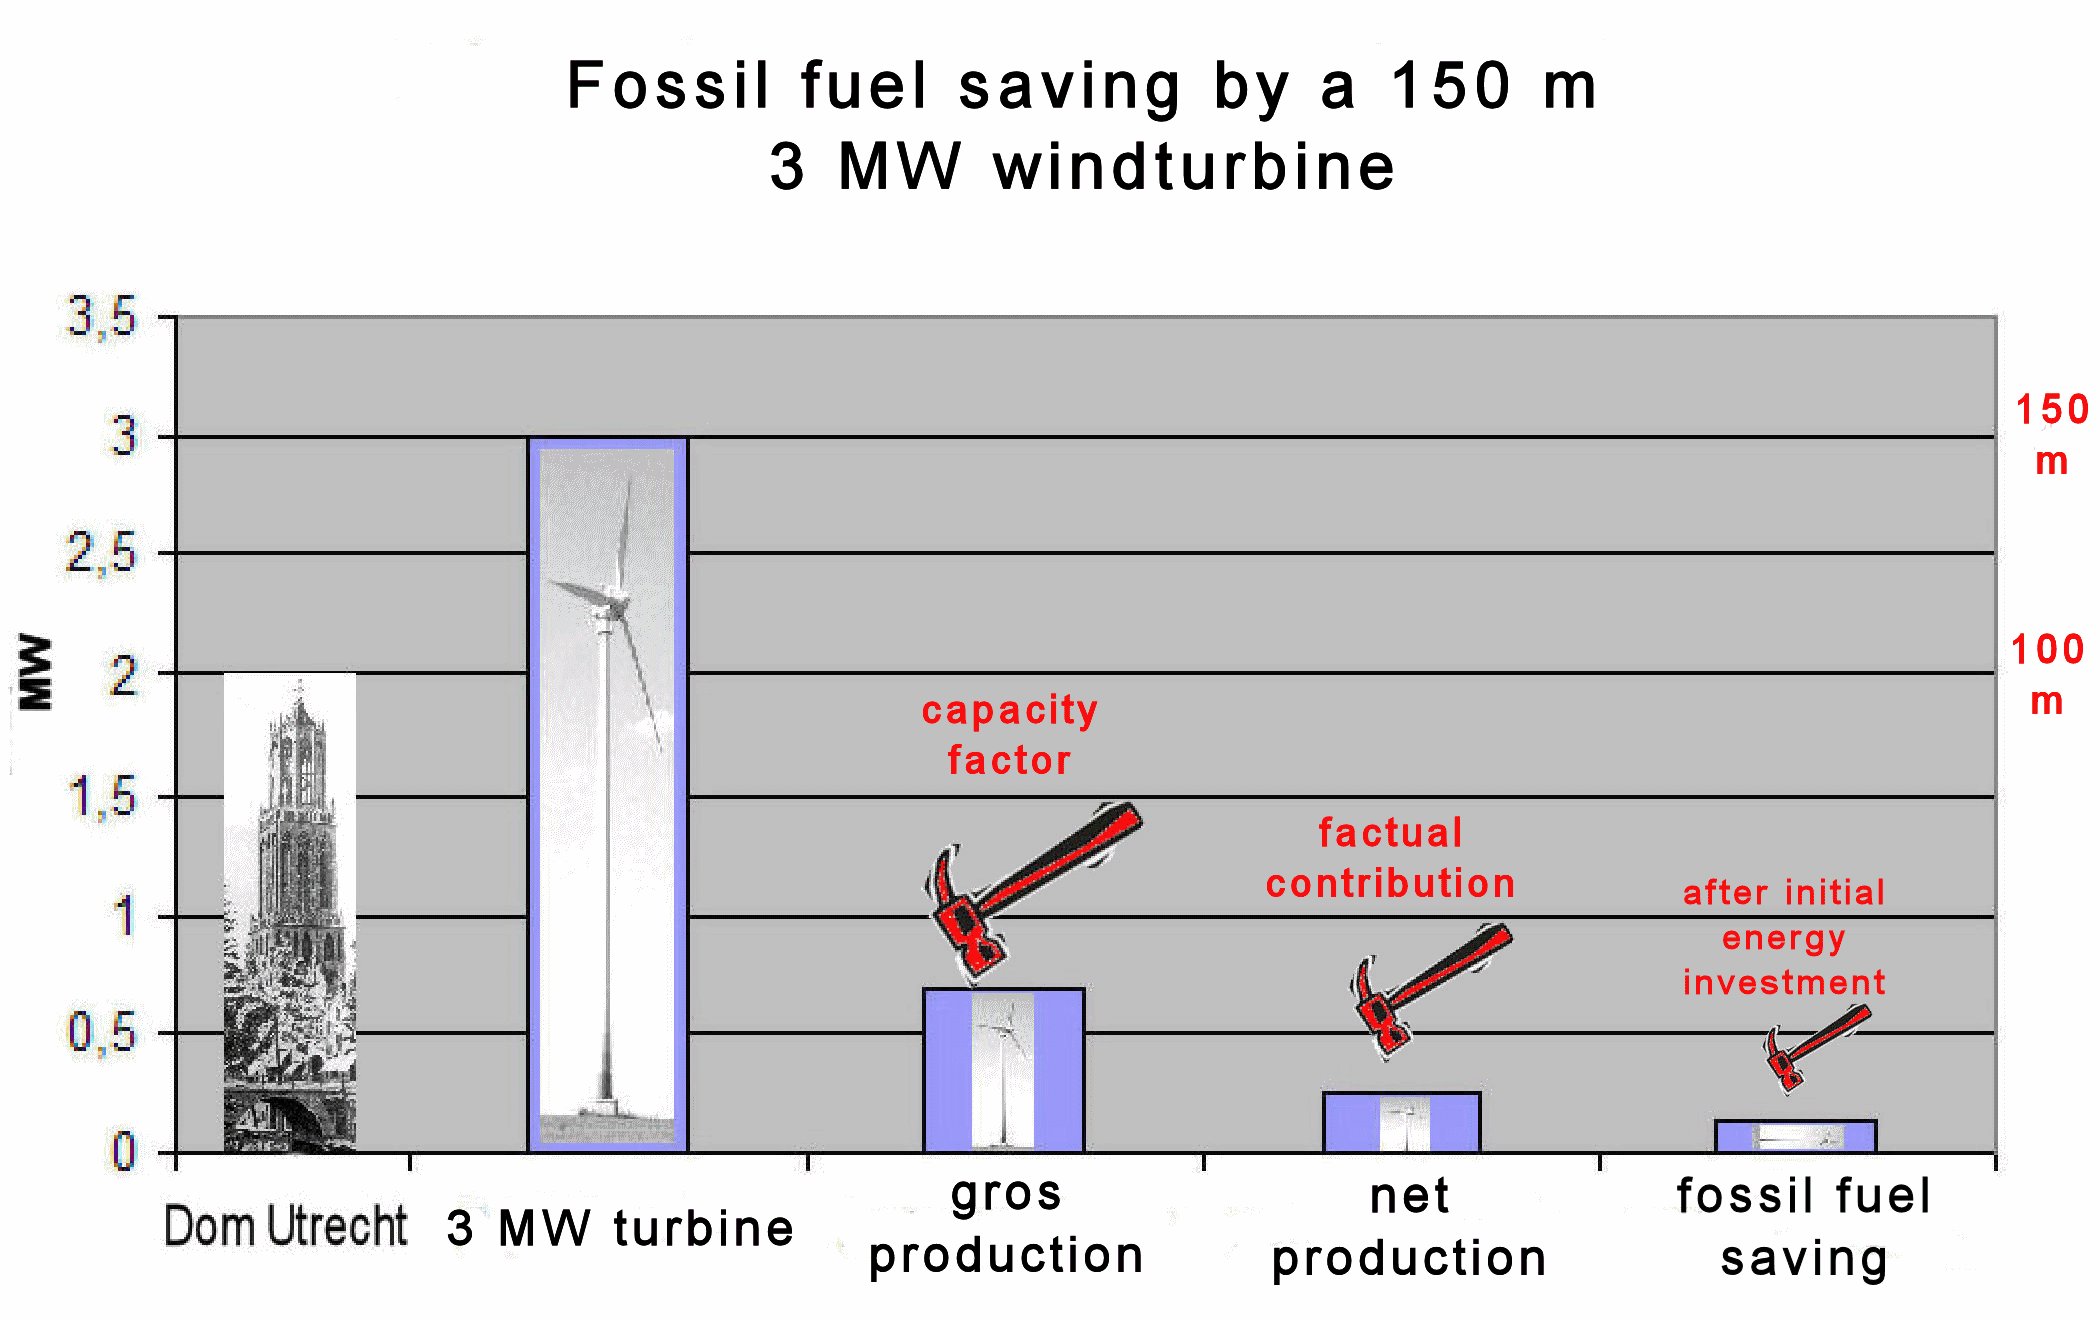
The marketing blurb on wind electricity would have us believe that a wind turbine earns its energy investment
back in about one half year of
production. (Gross production, i.e. production taking into account the capacity factor.) This is contrary to
our findings. According to research done by one of the main contractors installing
windturbines in the Netherlands and abroad, it takes about 1,5 year to earn the energy investment in
construction and installation back(20). Grid connection and adaptation plus extension of the high power grid was
not included in this result.
A more recent Australian study, analysed by F. Udo shows an earn back period of 2,8 year for Australia(21)(!). (In this
study the energy costs of onshore grid expansion and adaptation were included. Offshore requires more
energy. On the other hand distances in Australia are larger than in the Netherlands.)
For the energy involved in connection to the grid alterations in Western
Europe we have no data. Let us therefore consider the additional capital
investment in the grid in the Netherlands. Connecting wind developments to the grid in terms of money is
almost as costly as the construction
and installation of the turbines themselves. This is the case for onshore and offshore systems
taken together. (Onshore, of course, is much cheaper, but offshore is a big issue.)
In addition, the grid itself has to be re-enforced. In Germany recent estimates
predict an extra
4000 km high-Voltage lines have to be installed to handle wind production. The problem of overproduction when there is
adequate wind and the need to import electricity when there is a shortage, require regions to be connected. The Netherlands
has for that purpose recently laid two under-sea cables, one to Norway and one to the UK. (The cable to Norway
had already partly to be renewed after being in use for two years.) Combining all those
adjustments we conclude that the 1,5 year 'earn back time' of the turbines alone should at least be doubled. Thus we count for
3 year 'earn back time'.
Another dispute continues about the expected lifetime of wind turbines and their additions.
Promotors of wind turbines state a life time of 25 year. But the experience in the Netherlands is that wind
developments had already to be renewed after only 12 year of operation. Sharman reported that the useful lifetime of
wind turbines in Denmark is between 10 and 15 year (11). We would like to stick to facts, not to sales talk.
So we prefer to discount these 3 year of earn back time over a useful lifetime of 15 year. This means that
annually 20% of gross production must be subtracted from the net savings.
Conclusion and outlook
Adding it all up, one must conclude that under the present conditions in the
Netherlands a 100 MW (Megawatt) 'name plate' capacity wind development produces on average 23 MW because of the capacity factor.
4,6 MW (20%) of this has to be subtracted from the final net result because of initial energy investments. From the actual
Statline production figures we know that 27% of this 23 MW = 6,17 MW represents
the actual fossil fuel and CO2 savings. But from this figure
we need to
subtract the amount of energy invested in the construction works: 4,6 MW. The net total of fuel saving electricity
provided by our windturbines therefore is 6,17 - 4,6 = 1,57 MW on average over the year. That is ~
1,6% of the installed
capacity. It makes wind developments a Mega money pit with virtually no merit
in terms of the intended goal of CO2
emission reduction or fossil fuel saving.
What is going to happen next? The current plan is to extend wind capacity to 8
GW onshore and 4 GW offshore. Presently wind name plate capacity is about 15% of the average domestic
electric power need, which is roughly 14 GW. If the capacity
exceeds 20% we
enter into a new phase in which frequent curtailment sets in: there wil be periods in which the grid simply cannot
absorb the supply. This situation already exists in Denmark and Ireland. Then we shall see a further dramatic
decrease of the fuel-replacing effectiveness. In a previous study (6), we used a model in which
the most conservative scenario had a thus defined windpenetration of 20%. We found that in that
case savings were already negative, which means that
wind developments actually caused an increase in fossil fuel consumption. The present study based on
actual data shows that
we are well on the way to reach that stage.
Nieuwegein,
August 28, 2012.
Change record
▪ Improvements in the description of how we arrived at
the 'conclusion and outlook' inserted: August 22, 2012.
▪ G.Taylor drew attention to an arithmatic error. Correction
reduced the difference between fossil produced electricity
with and without wind to 0,163 GWy (previous version: 0,173).
As a result wind effectivity falls to 1,6% (previous 4%).
(Inserted: August 28, 2012).
▪ Following the advice of W.
Post, K. Hawkins, G. Taylor &
J. Boone the short note on the use of trendlines to describe
the system in the original paper has been extended to a more
extensive explanation. Inserted September 3d, 2012.
This article is a shortened version of a report in Dutch: 'Brandstofbesparing bij de
Nederlandse elektriciteitsvoorziening' sent to the Netherlands Government and Parliament in August 2012.
Parts usually well known to insiders have been left out. C. le Pair & K. de Groot: The impact of wind generated electricity on fossil fuel
consumption. K. de Groot & C. le Pair: The hidden fuel costs of wind generated electricity;
Spil 263-264(2009) nr.5, 15/17 & http://www.clepair.net/windsecret.html F. Udo, K. de Groot & C. le Pair: Wind turbines as a source of electricity;
F. Udo: Wind energy in the Irish power system;
http://www.clepair.net/IerlandUdo.html C. le pair: Electricity in The Netherlands; Wind turbines increase fossil fuel consumption and
CO2 emission; http://www.clepair.net/windSchiphol.html F. Udo: Wind energy and CO2 emissions -
2; http://www.clepair.net/Udo-okt-e.html C. le Pair, F. Udo & K. de Groot: Windturbines as yet unsuitable as electricity providers;
Europhysicsnews 43 (2012) nr.2, p. 22/5 & http://www.clepair.net/europhysics201203.html. F. Udo: Curtailment in the Irish power system; http://www.clepair.net/Udo-curtail201205.html W. Post, many contributions on The Energy Collective;
http://theenergycollective.com/index.php?q=willem-post/64492/wind-energy-reduces-co2-emissions-few-percent H. Sharman: Wind Energy, the case of Danmark; http://www.CEPOS.dk; download:
P.F. Bach (on his website): http://pfbach.dk BENTEK: How less became more. Wind, Power and unintended consequences in
the Colorado Energy Market, 2010. http://www.bentekenergy.com CBS, Statline: http://statline.cbs.nl/StatWeb/dome/default.aspx 1 GWy = 1 000 000 x 24 x 365 kWh. 1 kWh = 1000 x 3600 J. J = Joule.
1 TJ = 1012
Notes and references
J
http://www.clepair.net/windefficiency.html
http://www.clepair.net/windstroom%20e.html
http://www.cepos.dk/fileadmin/user_upload/Arkiv/PDF/Wind_energy_-_the_case_of_Denmark.pdf
G. Dijkema, Z. Lukszo, A. Verkooijen, L. de Vries, M. Weijnen: De regelbaarheid van elektrische centrales; een quickscan i.o.v. het Ministerie van Economische zaken, 20 april 2009.
http://www.energietech.info/groengas/theorie/gasmotoren.htm
Priv. comm. Borssele.
H.O. Voorma: Biobrandstoffen, lecture Zeist, 2012 04 18. Prof. (em) dr. Voorma, biochemist, former Rector Magnificus of Utrecht University
(2), note 13.
Lenzen, M.: Life cycle energy and greenhouse emissions of nuclear energy: a review; p. 137 ff. & Energy conversion and management 49 (2008) 2178-2199, download: http://www.isa.org.usyd.edu.au/. See also http://bravenewclimate.com/2009/10/18/tcase4/.